Understanding Your Electric Vehicle Dashboard
Your EV Dashboard Decoded
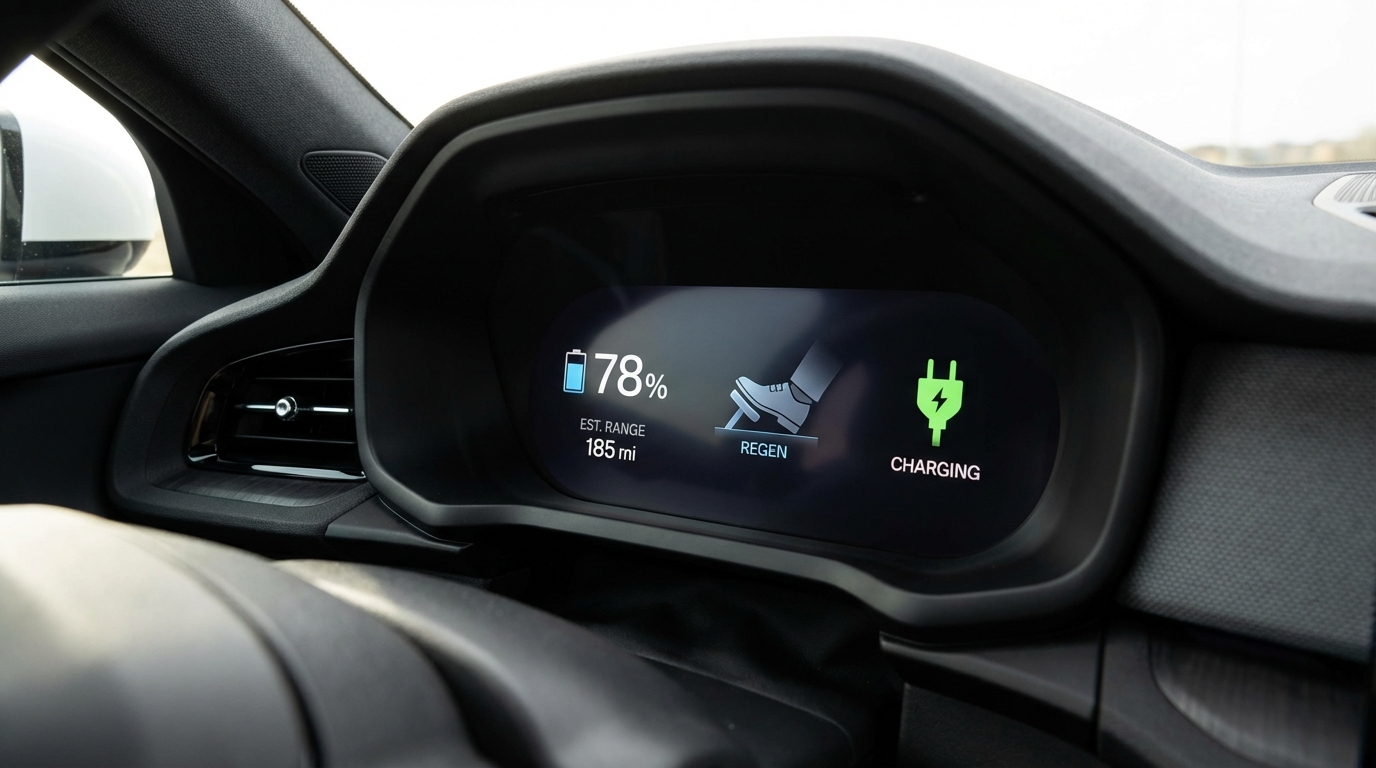
Switching from a gas vehicle to an electric vehicle means learning a new set of dashboard indicators. While EV dashboards share some familiar elements with conventional vehicles, several displays are unique to electric powertrains. Here's what you need to know.
State of Charge (SoC)
Think of State of Charge as your fuel gauge. It shows the percentage of battery capacity remaining, typically displayed as both a percentage and a visual bar graph.
Key takeaway: Unlike a fuel gauge, SoC is highly accurate — when it says 50%, you truly have about half your range remaining, though environmental factors can affect how far that 50% takes you.
Range Estimation
Your estimated range display predicts how many miles you can drive before the battery is depleted. This number fluctuates based on several factors:
- Speed: Highway speeds (70+ mph) consume significantly more energy than city driving
- Climate control: Air conditioning in Mojave summer heat can reduce range by 10–30%. Pre-conditioning your cabin while plugged in saves significant range.
- Terrain: Climbing grades uses more energy; descending recovers some through regenerative braking
- Temperature: Extreme heat (common in Mojave summers above 110°F) and extreme cold both reduce battery efficiency
Key takeaway: Treat the range estimate as a guide, not a guarantee. In Mojave Desert summer conditions, plan for 15–20% less range than displayed.
Regenerative Braking Indicator
Most EVs display a visual indicator showing when regenerative braking is active — the system that converts braking energy back into battery charge. You'll see this engage when you lift off the accelerator or press the brake pedal lightly.
Key takeaway: A strong regen display during deceleration means you're recovering energy. In stop-and-go traffic, regenerative braking can recover 10–20% of energy used.
Charging Status Icons
When plugged in, your dashboard shows what type of charging is active:
- Level 1 (120V): Slowest — adds roughly 3–5 miles of range per hour. Uses a standard household outlet.
- Level 2 (240V): Typical home or workplace charger — adds 20–30 miles per hour. The recommended daily charging method.
- DC Fast Charging (DCFC): Fastest — can add 100+ miles in 20–30 minutes. Used for road trips and quick top-ups.
Key takeaway: Know your charging level icon so you can verify your vehicle is charging at the expected rate, especially at public stations.
Battery Temperature Warning
Your EV monitors battery pack temperature and will display a warning if it gets too hot or too cold. In the Mojave Desert, high-temperature warnings are the primary concern, especially after DC fast charging in summer heat.
Key takeaway: If you see a battery temperature warning, the vehicle may temporarily limit power or charging speed to protect the battery. Park in shade when possible and avoid back-to-back fast charging sessions on the hottest days.
Tire Pressure & Energy Consumption
Tire pressure has a larger impact on range in EVs than in gas cars — even 5 PSI low can noticeably reduce range due to the heavier battery weight. Check pressure monthly, especially in the desert where day-night temperature swings cause 2–3 PSI fluctuations.
Your trip computer shows energy consumption in miles per kilowatt-hour (mi/kWh). A typical EV averages 3–4 mi/kWh — higher is better. Track this over time to spot efficiency changes.